An Exploration of Pursuing Professional Explorations

My Data Science Job Search: August - November, 2020 & December 2020 - April 2021

Rohan Lewis

2020.09.29 (Last Update 2021.05.13)

I began applying for Information Technology jobs on August 11th, 2020. I used LinkedIn as my primary source of information. I varied between large and small companies, EasyApply and normal applications via company job application portals or website submissions, and various locations across the US. I even applied to a job in Sydney, Australia (by accident) and a job in Toronto, Canada.

I took a break for about 6 weeks from November to December 2020. I have gradually tapered off in applications since mid March, and have stopped as of April 2021. The process is much different when you have a positive lead, and I have been working as a BioInformaticist Intern with IQVIA since early May.

I saved my application information in an Excel Spreadsheet as I applied. I decided to use it to practice some visualization techniques.

Complete code can be found here.

The same data was used to create this dashboard in Tableau.

I. Job Title

This section looks at the title of each job. As of 2021.04.21, I have applied to 1,162 jobs.

  1. I eliminated all non alphabetical characters.

  2. A recurring theme in job titles was numbering, such as "Data Analyst II" or "Data Scientist III". Since I had already eliminated numbers, I needed to eliminate Roman Numerals (only I, II, and III).

  3. I had some false negatives, so I fixed those.
    1. "AR VR" was changed back to "AR/VR" for one title.
    2. "C C" was changed back to "C2C" for one title.
    3. "Microsoft" was changed to "Microsoft-365" for one title.
    4. "Non IT" was changed back to "Non-IT" for one title.
    5. "E Commerce" was changed back to "E-Commerce" for one title.

  4. Words were then tallied.

Top 10 Words

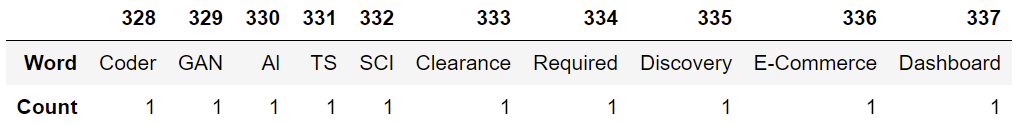
Some of the Bottom Words

There are many words that only occured once. Here are some of them.
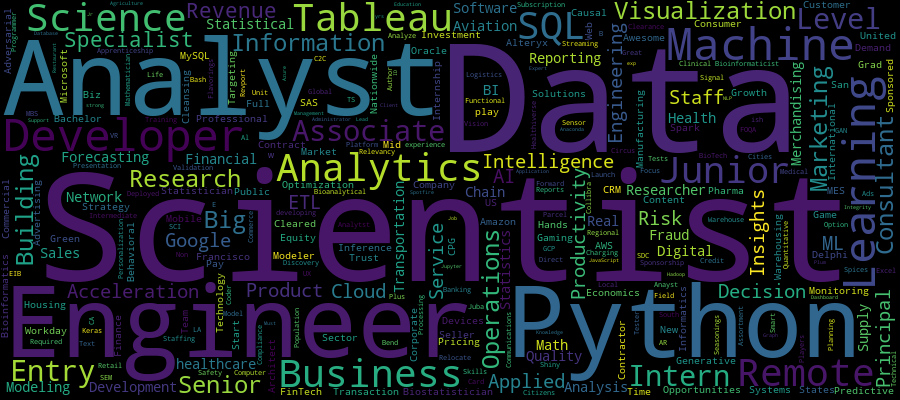
WordCloud

I thought a word cloud would be a fun representation to look at the job titles. The proportional size has been rescaled.

II. Company Applications by Date

Some companies are hiring heavily. Some are recruiting and staffing agencies for others.

Once my application was in a system on a particular company's career portal page, it was easy to reapply. I used this quite a bit for companies like Amazon, Google, MITRE, and PayPal.

I used LinkedIn's EasyApply for many applications as well.

For the others, I sometimes applied as a guest, sometimes only had to upload my resume and cover, sometimes had to go through a 20 minute ordeal just for one opening. It varied. ¯\_( ͡° ͜ʖ ͡°)_/¯.

Below is an animation of the above data. Bar chart races run more smoothly with larger numbers, like population, or monetary amounts, over longer periods of time. But I am reasonably happy the way this turned out.

III. Job Location

Cities

Some slight modifications were made from LinkedIn data during the application process:

  1. For Curate Partners, a job location was changed from Raleigh-Durham-Chapel Hill Area to Raleigh.
  2. For Parker & Lynch, a job location was changed from Orange County to Los Angeles.
  3. For Synectics, a job location was changed from Greater Chicago to Chicago.
  4. For several companies, job locations were changed from "San Francisco Bay Area" to "San Francisco".
  5. For several companies, job locations were changed from "Greater" or "Metropolitan" of a city to that city.
  6. For several companies, job locations were changed from "Washington DC-Baltimore Area" to either "Washington DC" or "Baltimore".

Remote

Several jobs were advertised with no city, only remote. I had to manually fill in the city.

Missing Cities

Several jobs I applied to were in cities not in the spreadsheet I joined with.

Two were from Australia and one from Canada.

For the others, I retrieved latitude and longitude values from Google. An approximate average value was chosen for Dallas-Ft. Worth.

US Interactive Map

Applications are sorted by city and state.

IV. Waffle Plot

Below is the distribution of applications by state. States with less than 8 applications are grouped in Other.