III. Statistical Analysis
Complete test results can be found here.
Hypothesis:
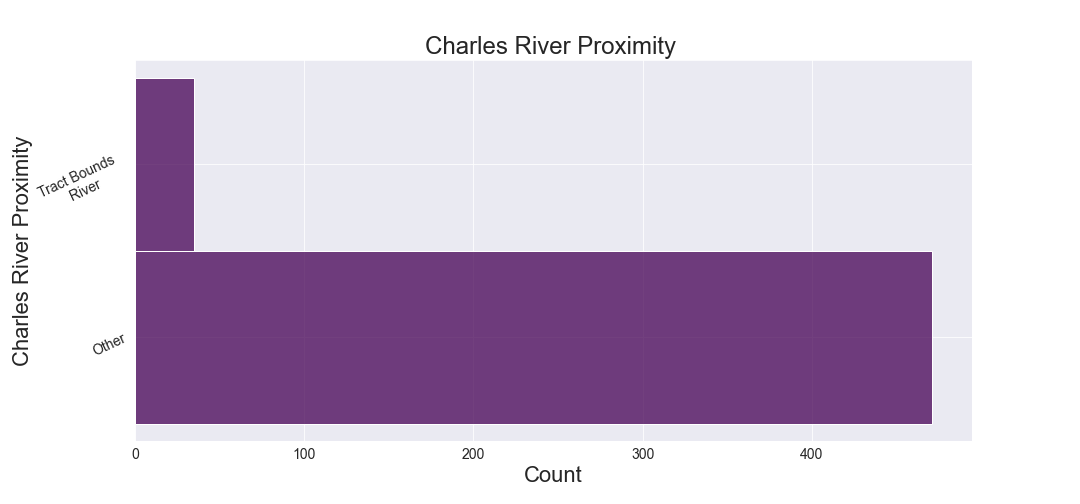
The median value of houses bounded by the Charles River is different from that of those which are not.
H0:
$M_{CR} = M_{0}$
HA:
$M_{CR} ≠ M_{0}$
Conclusion
The Levene Test was first run to determine equality of variances of the median value houses bounded by the Charles River and that of those which are not. The $\text{p-value} = 0.003 < 0.05$, so we can assume unequal variances.
Running the T-test for Independent Samples, the $\text{p-value} = 7.39 * 10 ^{-5} < 0.05$. The null hypothesis is rejected as there is significant evidence that the median value of houses bounded by the Charles River is different from that of those which are not.
Hypothesis:
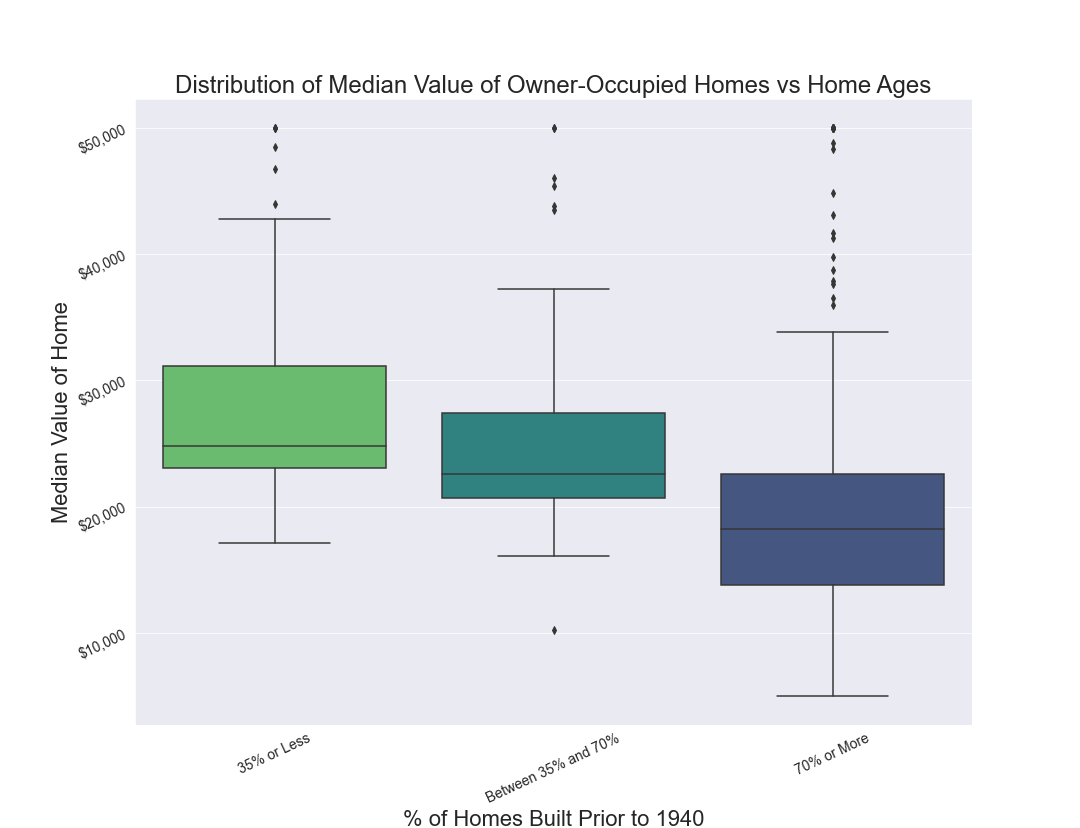
The median value of houses, depending on the proportion of houses built prior to 1940, are different.
H0:
$M_{35} = M_{35-70} = M_{70}$
HA:
$M_{35} ≠ M_{35-70}$ or
$M_{35-70} ≠ M_{70}$ or
$M_{70} ≠ M_{35}$
Conclusion
The Levene Test was first run to determine equality of variances of the median value houses, depending on the proportion of houses built prior to 1940. The $\text{p-value} = 0.063 > 0.05$, so we can assume equal variances among t he three groups.
Running the ANOVA, the $\text{p-value} = 1.71 * 10 ^{-15} < 0.05$. The null hypothesis is rejected as there is significant evidence that the median value of houses is different between at least one pair of the groups split by proportion of houses built prior to 1940.
3) Nitric Oxide Concentrations and Proportion of Non-Retail Business Acres
Hypothesis:
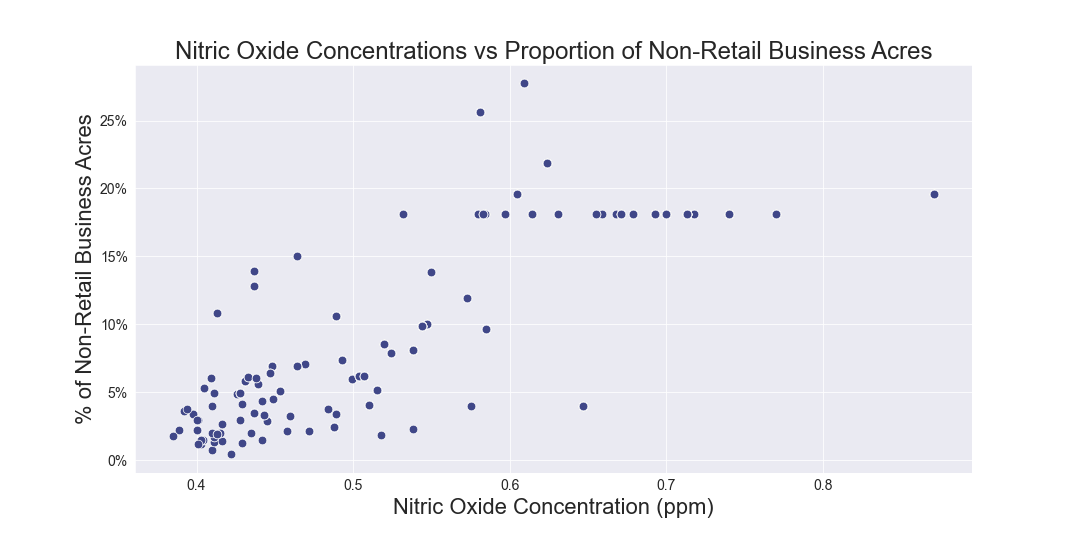
There is no relationship between Nitric Oxide concentrations and the proportion of non-retail business acres per town.
H0:
Nitric oxide is not correlated with proportion of non-retail business acres.
HA:
Nitric oxide is correlated with proportion of non-retail business acres.
Conclusion
Running the Pearson Correlation Test, the $\text{p-value} = 7.91 * 10 ^{-98} < 0.05$. The null hypothesis is rejected as there is significant evidence that nitric oxide is correlated with proportion of non-retail business acres.
Hypothesis:
The weighted distance to the five Boston employment centres impacts the median value of owner-occupied homes.
H0:
$m = 0$.
HA:
$m ≠ 0$.
Conclusion
Running Regression Analysis, the $\text{p-value} = 1.21 * 10 ^{-8} < 0.05$. The null hypothesis is rejected as there is significant evidence that the weighted distance to the five Boston employment centres impacts the median value of owner-occupied homes.
Furthermore, an additonal weighted distance increases the median value by $\$1,091.61$.