IV. Variable Distributions
1. Outcome Variable - Severity Code
Of the 146,355 collisions remaining from the data cleaning,
- 98,273 accidents, or 67.1%, caused property damage.
- 48,082 accidents, or 32.9%, caused injury.
This 2:1 ratio will be important throughout the analysis and modeling.
2. Date

There seems to be slightly more accidents from 2005-2008 and slightly less from 2011-2013, but overall the variance seems to be within reason.
3. Day of Week
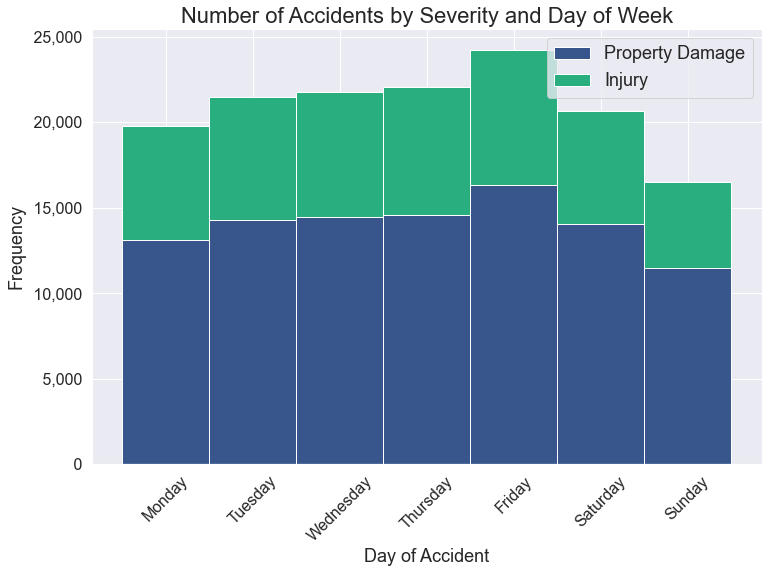
While there are definitely more accidents on Friday (perhaps stressed from the work week, perhaps more traveling for longer periods for the weekend) and fewer on Sunday (perhaps more relax at home), the ratio of Property Damage to Injury by day reflects the overall ratio of 2:1.
4. Time
If accidents were uniformly distributed across time of day, there would be approximately 102 accidents per minute.

However, that is far from true! It is clear that the majority of accidents happen in the business, lunch, and daylight hours of 8:00 - 18:00.
There seems to be a disproportionate number of accidents reported on, in decreasing order:
- Every hour, particularly between 12:00 - 18:00.
- Every half hour, particularly between 12:30 - 18:30
- Every quarter hour.
- Every :10, :20, :40, and :50.
- Every :05, :25, :35, and :55.
Lastly, there was a disproportionate spike at 00:01:00, which means accidents being purposely documented to the next day was not uncommon. I found this extremely fascinating, perhaps for bureaucratic reasons, quotas, night shift, etc. Upon further investigation, I learned these times did not coincide with specific dates such as 1st of a month. See the complete analysis.
5. Address Type
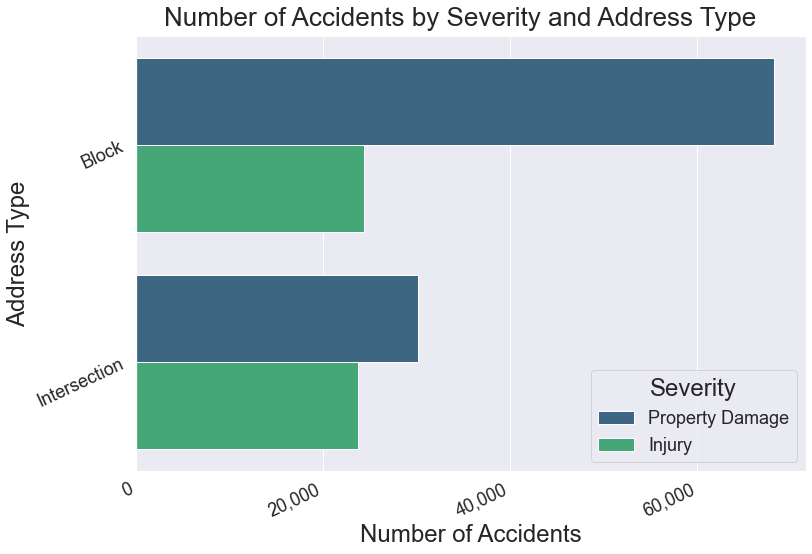
The majority of property damage occurs on blocks, but injury occurs about equally between blocks and intersections.
Intersections are usually larger and have more road space and less businesses and buildings compared to blocks.
This variable is the only one where the ratio of of Property Damage to Injury did not reflect the overall ratio of 2:1.
6. Light Conditions
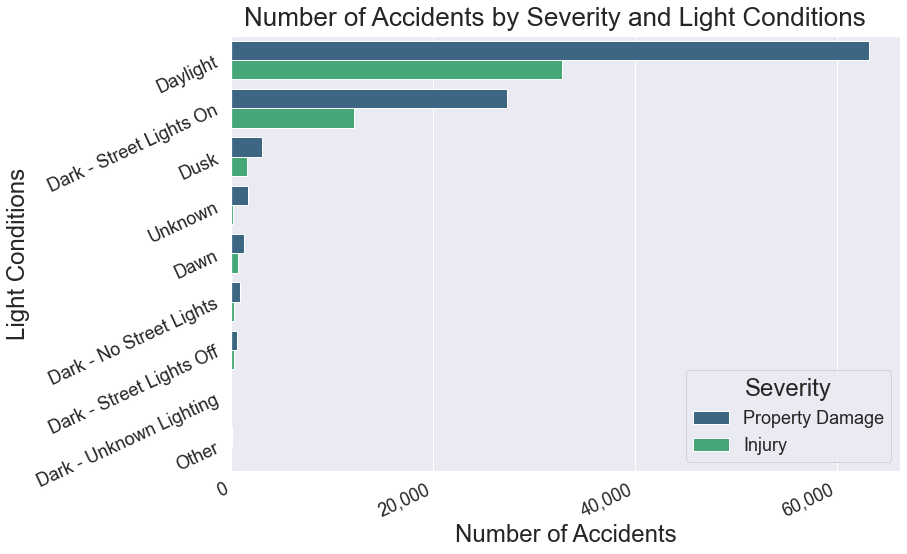
The vast majority of accidents occur during Daylight and Dark - Street Lights On. The values of Property Damage and Injury reflect the overall ratio of 2:1.
7. Road Conditions
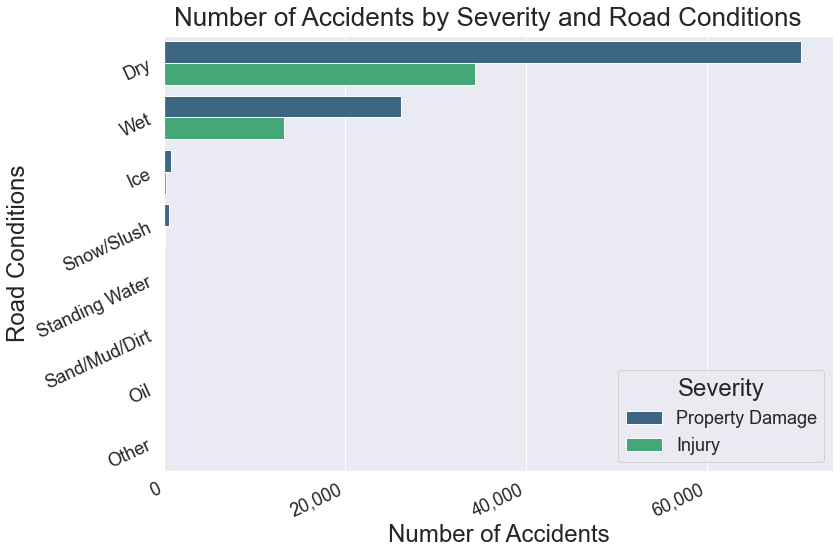
The vast majority of accidents occur during Dry and Wet. The values of Property Damage and Injury reflect the overall ratio of 2:1.
8. Weather Conditions
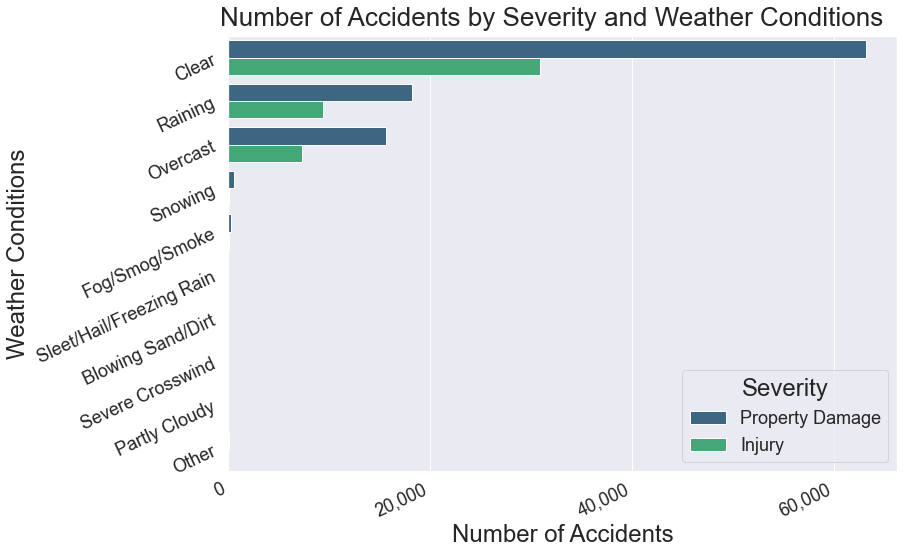
The overwhelming majority of accidents occur during Clear, Raining, and Overcast. The values of Property Damage and Injury reflect the overall ratio of 2:1.
V. Machine Learning and Results
1. Classification Models.
The data was split into training (70%) and test (30%) sets. For one training/test set, Latitude and Longitude was kept for location, Neighborhood was dropped. For the other training/test set, Neighborhood was kept for location, Latitude and Longitude was dropped.
I then ran four machine learning algorithms for both the Latitude/Longitude and Neighborhood training sets.
- Decision Tree (Random Forest)
- K-Nearest Neighbors
- Logistic Regression
- Support Vector Machine (LinearSVC with Ridge)
Each model was run in a validation curve simulation to optimize its respective parameter/hyperparameter. Once the optimized parameter/hyperparameter was determined, a model was used to determine the score.
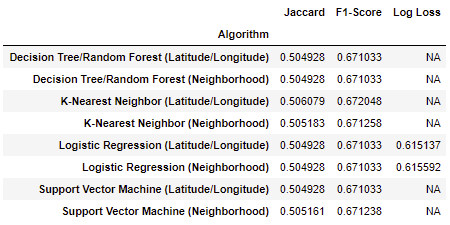
2. Train Set Results
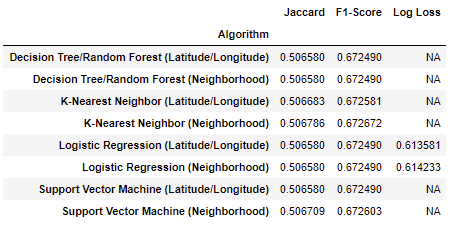
3. Test Set Results
VI. Discussion and Conclusion
Four models, using two different location measures, were evaluated on the training set and test set. Note that all 16 results are within 67.1-67.3%. I could not immediately see a significance in the difference between Latitude/Longitude or the Neighborhoods. Neighborhoods did take longer to run in general, as about 90 dummy variables were added to categorize all neighborhoods with non-zero accident counts.
Using Neighborhood as the location predictor, K-Nearest Neighbors at 500 Neighbors and a Linear Support Vector Classifier applying a L2 penalty yielded 67.27% and 67.26% accuracy. The SVM took less than 30 seconds, whereas the KNN took several hours.
Since Property Damage and Injury occur approximately $\dfrac{2}{3}$ and $\dfrac{1}{3}$ of the time, randomly classifying Property Damage $\dfrac{2}{3}$ the time and Injury $\dfrac{1}{3}$ the time would yield an accuracy of $\left(\dfrac{2}{3}\right)^2+ \left(\dfrac{1}{3}\right)^2 = \dfrac{5}{9} \approx 55.6\%$. The learned model seemed to be a significant improvement from that.
K-Nearest Neighbor (N = 500, Neighborhood as location)

Linear Support Vector Classifier ($C = 10^{-3}$, Neighborhood as location)
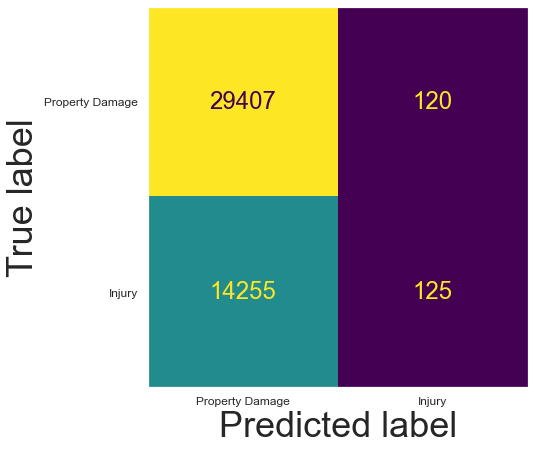
My best algorithms are ~67% accurate because they are classifying accidents as Property Damage ~99% of the time, and ~67% of accidents happen to be Property Damage!
The predictors I used were immediate predictors related to the scene and setting of an accident. Some other predictors, perhaps, number of cars, pedestrians, speeding, under the influence, etc., could possibly be useful and improve accuracy, but require more time to gather details. In addition, if one were at the scene of the accident gathering those variables, one could easily determine if there were Property Damage or Injury. Prediction then becomes unnecessary because one can simply document the result at the scene.
The analysis suggests that accidents in general should be predicted as "Property Damage" twice as often as "Injury". The variable distributions across Date/Day/Time and Light/Road/Weather Conditions strongly support this notion.
Variable interaction could possibly make a difference. Due to the consistency of the 2:1 ratio among labels within variables, as well as computing power limitations, I decided not to explore this.
The dataset did not specify collisions which had both property damage and injury. It would be interesting to see how many would be labeled as such, and if any variables are correlated with it.